On February 24, 2021, the fifth session in a series of webinars on academic writing was organized by the Women's Scientific Research Committee of the Bachelor of Arts in English program. Hosted by Dr. Nada Alqarni, this session focused on the task of reporting qualitative results in scientific research papers.
📊 Academic Writing Series: Session Four
"Reporting Quantitative Results"
Presenter: Dr. Nada Al-Qarni | Date: Feb 22, 2021
Organizer: Women's Scientific Research Committee (BA in English Program)
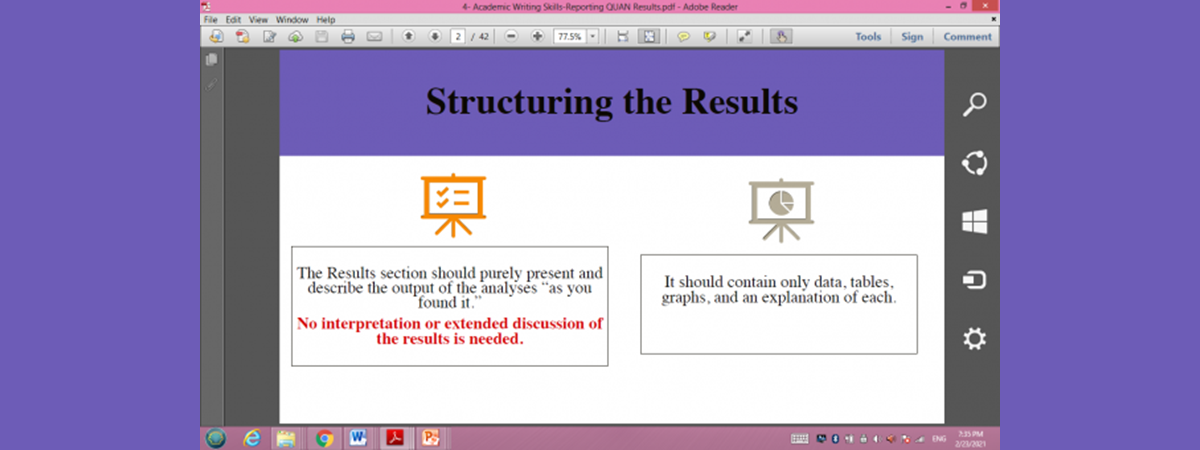
The webinar, titled "Reporting Quantitative Results," opened with an in-depth discussion on the structuring of results in research papers. Dr. Al-Qarni delineated the approaches for reporting both quantitative and qualitative results, with this particular session spotlighting the former. A thorough explanation of statistical concepts and analytical techniques was provided.
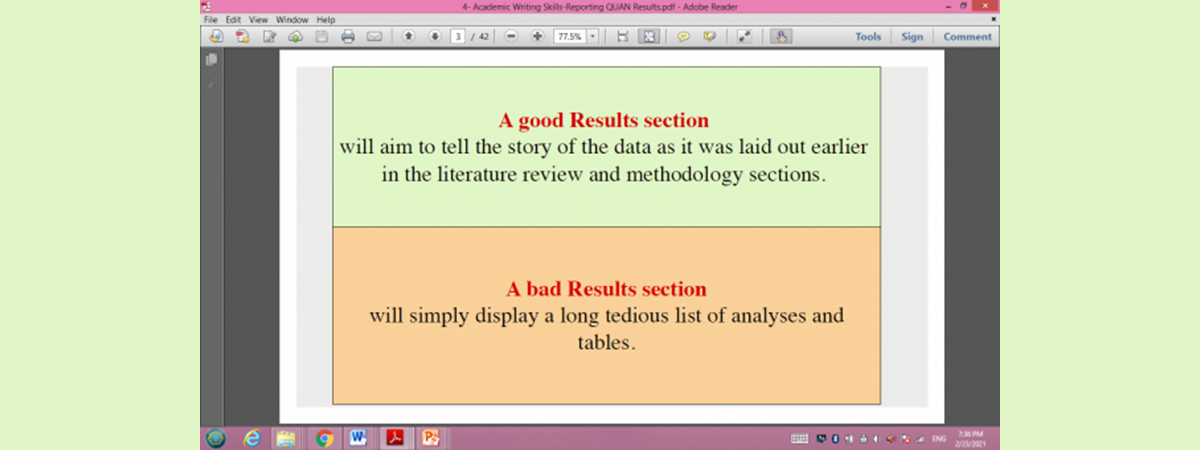
In a comparative study of appropriate and inappropriate results sections, Dr. Al-Qarni highlighted that a well-structured results section should narrate a coherent story. On the contrary, a poorly executed results section tends to deliver long-winded and monotonous analysis.
Structuring the Results Section
Focus: Reporting Quantitative Results (statistical concepts, analytical techniques).
Well-structured: Narrates a coherent story.
Poorly executed: Long-winded, monotonous analysis.
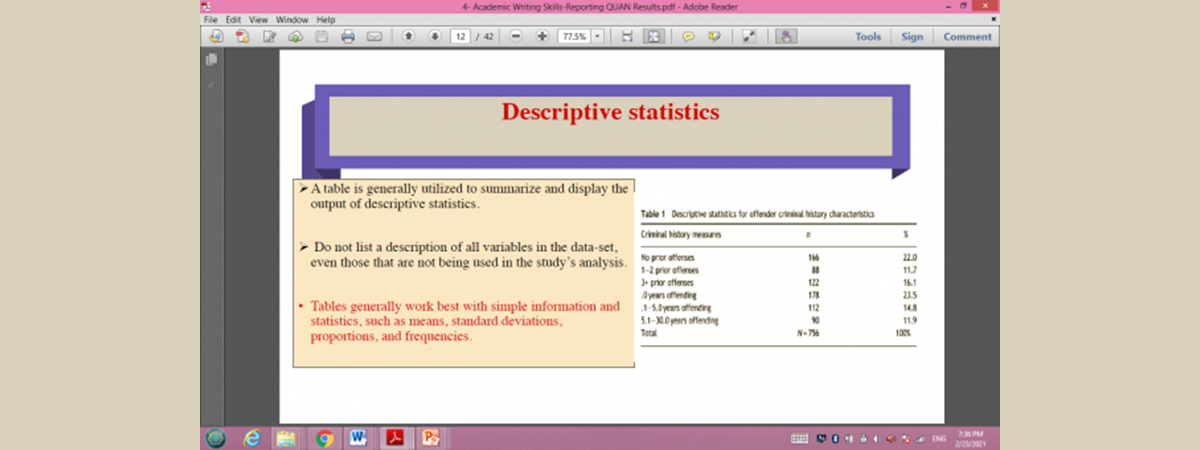
Focusing on the presentation and interpretation of results, Dr. Al-Qarni emphasized the need for utilizing a suitable statistical program, with SPSS being introduced as an example. She stressed that descriptive statistics, including mean, median, standard deviation, frequencies, and proportions, should be used for the comprehensive analysis of variables.
The discussion also covered the organization of the results. Dr. Al-Qarni recommended the use of sub-sections and sub-headings to aid reader comprehension. The incorporation of visual aids like charts, graphs, and tables can support and elucidate the results. However, these should be used judiciously and only when necessary.
📈
Presenting & Organizing Quantitative Results
Statistical Tools: Utilize suitable programs (e.g., SPSS). Use descriptive statistics (mean, median, SD, frequencies, proportions).
Organization: Use sub-sections & sub-headings. Judicious use of visual aids (charts, graphs, tables) to support results.
Toward the end of the session, Dr. Al-Qarni explored the common purposes of data and contrasted different sets of data. She also provided guidance on the type of language that should be employed when reporting results.
The session, which attracted students and faculty members from undergraduate, graduate, and postgraduate programs at the College of Languages and Translation, offered valuable insights into the effective communication of quantitative results in academic writing.
🎯
Data Interpretation & Language Guidance
Explored common data purposes, contrasted data sets, and advised on appropriate language for reporting results.
Valuable insights for UG, PG students & faculty on effective communication of quantitative results.